Weekly Bond Market Commentary
As the World Changes, Fixed Income Remains Constant
By Doug Drabik
July 22, 2019
There are many things changing in today’s world, bond characteristics are not among them:
- The U.S. population is aging. In 2010, the U.S. Census Bureau reported 55+ year olds represented 24.3% (74 million) of the population. By 2016 there were 88.6 million persons 55+ or 27.8% of the population. (A 7 year Treasury note purchased in 2010 at 3.384% was still earning the investor 3.384% in 2016)
- By 2035, the Census Bureau predicts that there will be 78 million people 65 years and older compared to 76.7 million under 18. (By comparison, the 2016 census had 81.8 million 0-19 years and 47.5 million 65+.) (A 20 year municipal bond purchased by a high tax bracket investor at a 3.74% tax-equivalent yield purchased today will still be earning 3.74% in 2035, regardless of where interest rates go.)
- Based on 2016 Census Bureau’s numbers, 55+ represent 27.8% of the population yet hold 61.2% of the net worth. (Whatever new products arise or however interest rate fluctuate, investors’ individual bond holdings will provide the income streams and cash flows from purchase to maturity.)
- As consumer spending represents a large portion of the U.S. GDP, changing demographics could play a major role in future growth. For example, the older population likely owns their home and is not necessarily furnishing one. However healthcare, pharmacy and assisted living products and services may be in demand. (Shifts in demand for various products may change the pricing of those products but will have no effect on a bond’s performance if already held. A corporate bond purchased and held at 3.00% when little demand existed will still be yielding the investor 3.00% should the market’s demand shift on new issue bonds.)
- The oldest millennials are reaching 40 years of age and slowly coming into the generation bucket most likely to spend. This generation has been late bloomers in terms of purchasing homes and being more sedentary in jobs and dwellings but as they start raising families, it is plausible this shifts purchasing patterns. (Spending patterns and types of products and services will shift, but individual bond earnings will remain constant from their purchase date.)
- Monetary policy is dominating fiscal policy around the globe. Nations are finding it difficult to support national budgets and social programs through fiscal actions such as taxes; however, through monetary policy and their central banks, countries are creating money through quantitative easing or mass open market purchasing programs. (During a fixed income holding period, policies change, interest rates fluctuate, tax laws evolve, supply and demand shifts pricing, etc. Despite the dynamics, already purchased fixed income can expect to remain constant.)
- According to Bloomberg data, at the start of 2010, the four major central banks (European Central Bank, Bank of Japan, Peoples Bank of China, Federal Reserve) had combined assets of $9.5 trillion. At the end of June, 2019, that number was $19.7 trillion. (A 10 year Treasury yielding 3.85% purchased in 2010 was still earning the investor 3.85% yield in June, 2019)
- The world will continue to transform. The stock market will have positive and negative days. Interest rates will move bond prices up and down. Governments will seek various means to support and grow their economies. Bonds held in the portfolio to maturity, barring default, will perform exactly as they were intended to perform from the day of purchase through their maturity.
To learn more about the risks and rewards of investing in fixed income, please access the Securities Industry and Financial Markets Association’s “Learn More” section of investinginbonds.com, FINRA’s “Smart Bond Investing” section of finra.org, and the Municipal Securities Rulemaking Board’s (MSRB) Electronic Municipal Market Access System (EMMA) “Education Center” section of emma.msrb.org.
The author of this material is a Trader in the Fixed Income Department of Raymond James & Associates (RJA), and is not an Analyst. Any opinions expressed may differ from opinions expressed by other departments of RJA, including our Equity Research Department, and are subject to change without notice. The data and information contained herein was obtained from sources considered to be reliable, but RJA does not guarantee its accuracy and/or completeness. Neither the information nor any opinions expressed constitute a solicitation for the purchase or sale of any security referred to herein. This material may include analysis of sectors, securities and/or derivatives that RJA may have positions, long or short, held proprietarily. RJA or its affiliates may execute transactions which may not be consistent with the report’s conclusions. RJA may also have performed investment banking services for the issuers of such securities. Investors should discuss the risks inherent in bonds with their Raymond James Financial Advisor. Risks include, but are not limited to, changes in interest rates, liquidity, credit quality, volatility, and duration. Past performance is no assurance of future results.

By Drew O’Neil
July 8, 2019
If we all had a crystal ball that allowed us to see exactly what was going to happen in the future, the task of portfolio allocation would be much easier. We could simply invest 100% of our available funds into the asset class that was going to perform the best, sell at exactly the right moment, and then reinvest into the next best performing asset class. The entire challenge of both asset class selection and timing would be removed and investing would be much easier. Unfortunately, seeing into the future proves to be a difficult task.
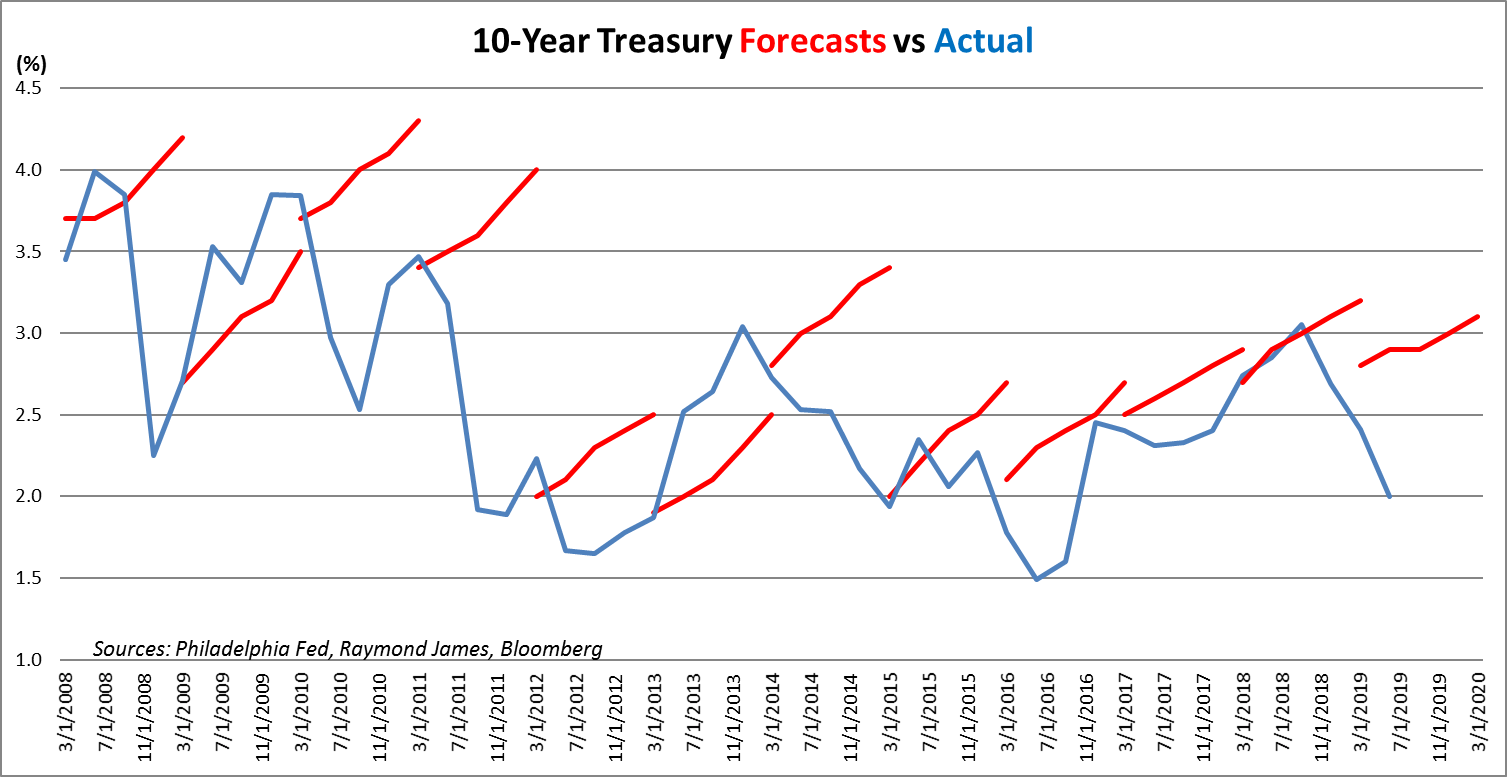
We are left to rely on forecasters’ predictions as to what they think might happen when considering how to invest. Many of these forecasters are extremely intelligent, have incredibly sophisticated models, very well thought out theories, and powerful computers all working together to give their best guess on how to optimize returns based on what is potentially going to happen in the future. Unfortunately, when it comes down to it, they are still trying to predict the future, which is unknowable, even to the smartest among us. The graph below highlights just how hard predicting the future is. The red lines represent a Philadelphia Fed survey taken at the beginning of every year on the consensus estimates from some of the smartest economic minds in the country, projecting what the 10-year Treasury will do over the next 5 quarters. The blue line represents what the 10-year Treasury actually did.
The graph speaks for itself… predicting the future is very hard to do. So how should we position our portfolios without knowing what is going to happen next? That is where an appropriate asset allocation fits in. Properly splitting up your assets between stocks and bonds (and potentially commodities, real estate or whatever else your analysis deems appropriate) can set you up to hopefully weather any storm. Maintaining an appropriate allocation to fixed income, based on your risk tolerance and goals, is important regardless of what you think is going to happen next, because as the chart above tells us, even though you think you know what is going to happen next, you likely do not.
Where investors can get into trouble is when they allocate money that is earmarked for fixed income to other asset classes, either in a reach for yield and/or total return, or because they are sure that equities are going to outperform over the next 12 months. Fixed income is generally supposed to be the stable portion of the portfolio, providing consistent cash flow, income, and return of principal. It is not intended to provide annual returns of +10% (although sometimes it does), it is intended to be stable and consistent. The numbers below shine some light on why you own fixed income, especially in the face of uncertainty in the economy. Going back 30 years, take a look at the worst years for each of these three asset classes:
A “bad” year in fixed income generally does not hurt near as much as a bad year in equities. No one knows for sure what is going to happen over the next month or year… stick with your allocation. A portfolio of high-quality bonds is typically not intended to make you wealthy, its purpose is to help you maintain the wealth that you have already accumulated.

Doug Drabik
July 1, 2019
This is a very difficult interest rate environment for investors. Finding value is at a premium. It is important to know why you own particular assets, insist on investing discipline and to keep it all in perspective. The corporate sector can provide critical value for investors with the goal of maintaining core holdings designed for wealth preservation with a defined income stream.
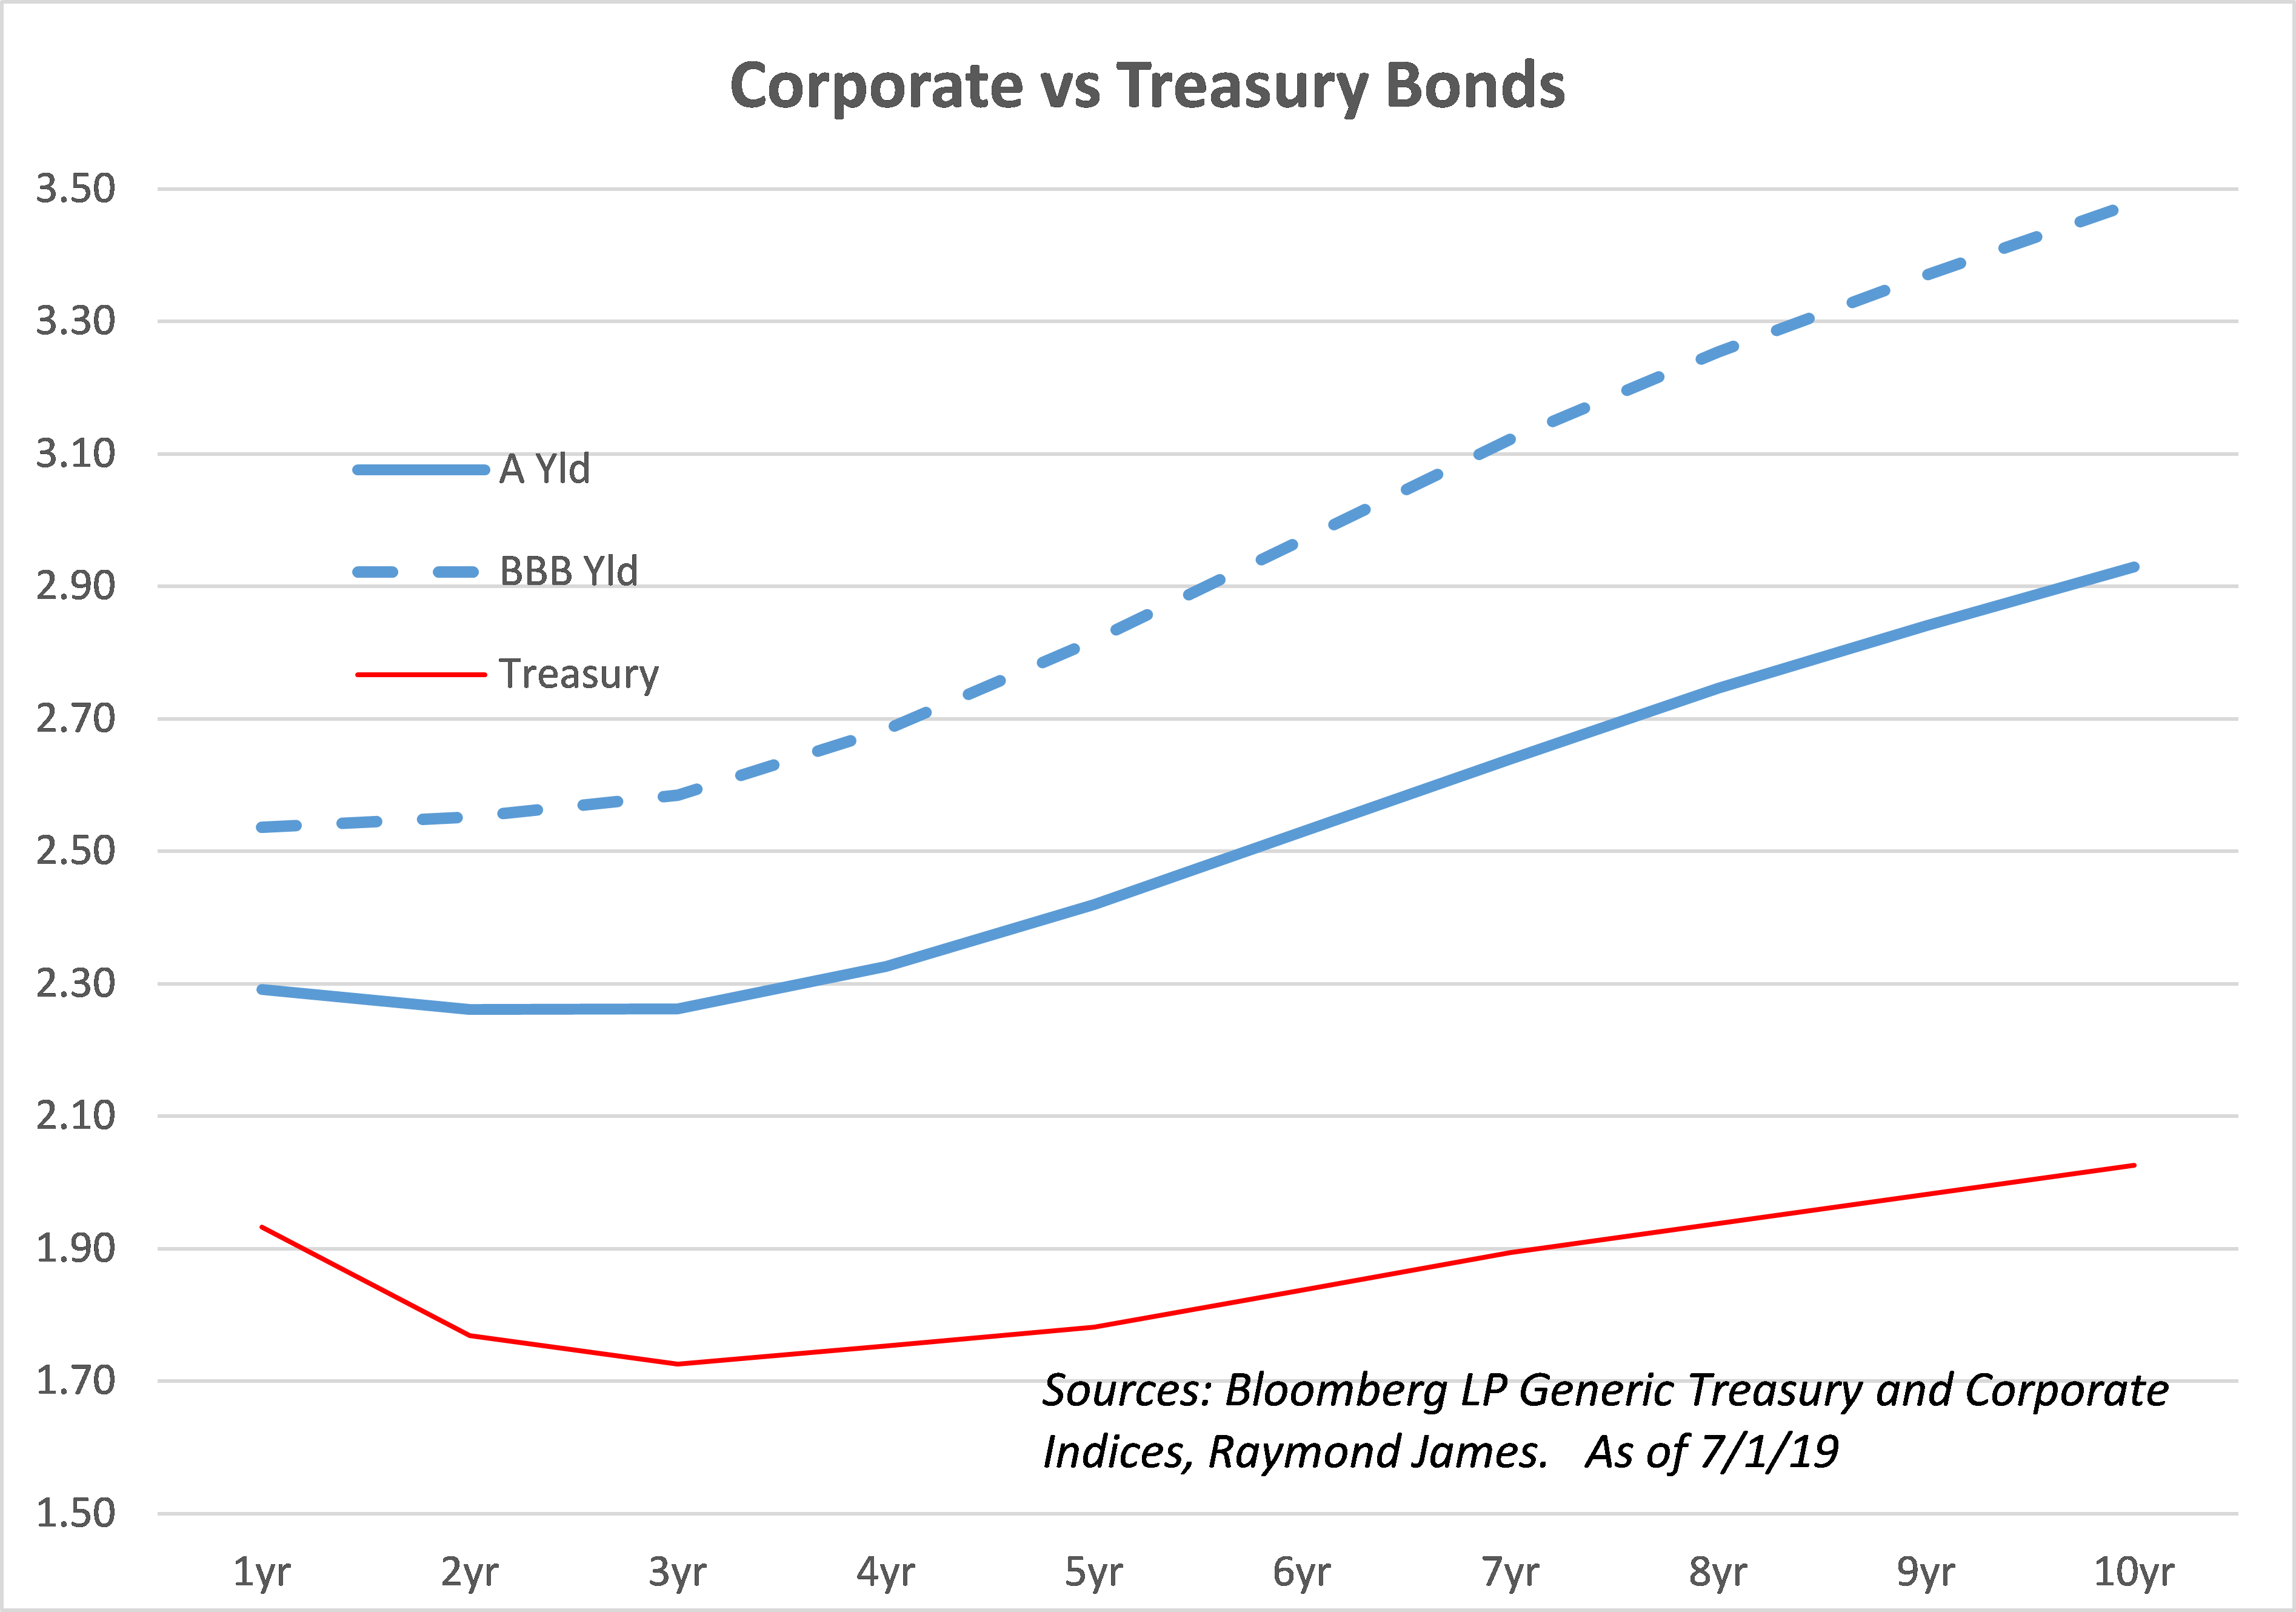
Although media outlets tend to focus on Treasury rates when discussing value, the truth is that many Raymond James investors utilize spread products such as CDs, municipal bonds and/or corporate bonds to build their core investment base. Note on the graph to the right how the investment grade corporate bond curve has remained positively sloped with significant spread to the Treasury curve.
Keeping this in perspective is equally important. U.S. rates are affected by global events and economies. Although discussing 2.00% yields doesn’t gather much enthusiasm, the U.S. actually sits in a rather envious position relative to many economic powers (see chart to left). The great interest rate disparity continues and it doesn’t appear that this is about to end anytime soon.
The European Central Bank (ECB) has recently announced their intent to use any tool at their disposal, including more quantitative easing (QE) to spur economic activity. The continued accommodative monetary practices in Europe and Asia have grown their balance sheets and kept interest rates low but now as the world’s negative interest rate debt has grown to nearly $13 trillion, it adds to the argument that interest rates may remain low for a long time. The added income associated with U.S. debt emerges as a significant advantage for investors. Take for example the yield difference of 244bp between the U.S. 5-year Treasury yield of 1.781% and Germany’s -0.662%. U.S. rates are significantly better. Now combine that U.S. yield with the spread and investors enjoy relatively sound income with a designed purpose to help preserve capital.
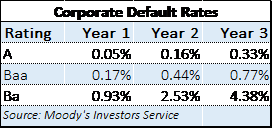
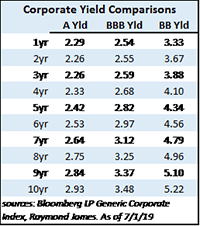
Treasury bonds are considered very safe assets. How do corporate bonds stack up from a credit perspective? Moody’s reports that historically, there is less than a 1% default rate over a 3-year timeframe for A-rated and Baa-rated bonds (from 1970 to 2017). The significant default rate with corporate bonds does not occur until the rating drops to Ba or high yield status. This is important when developing strategy. The additional yield associated with Baa-rated compared to A-rated may be worth the slight default difference for some investors but the jump from Baa 0.77% default rate to Ba 4.38% default rate may cause investors to pause. After all, a primary objective for many investors in fixed income is protecting their principal. Let’s take a look at how yields compare:
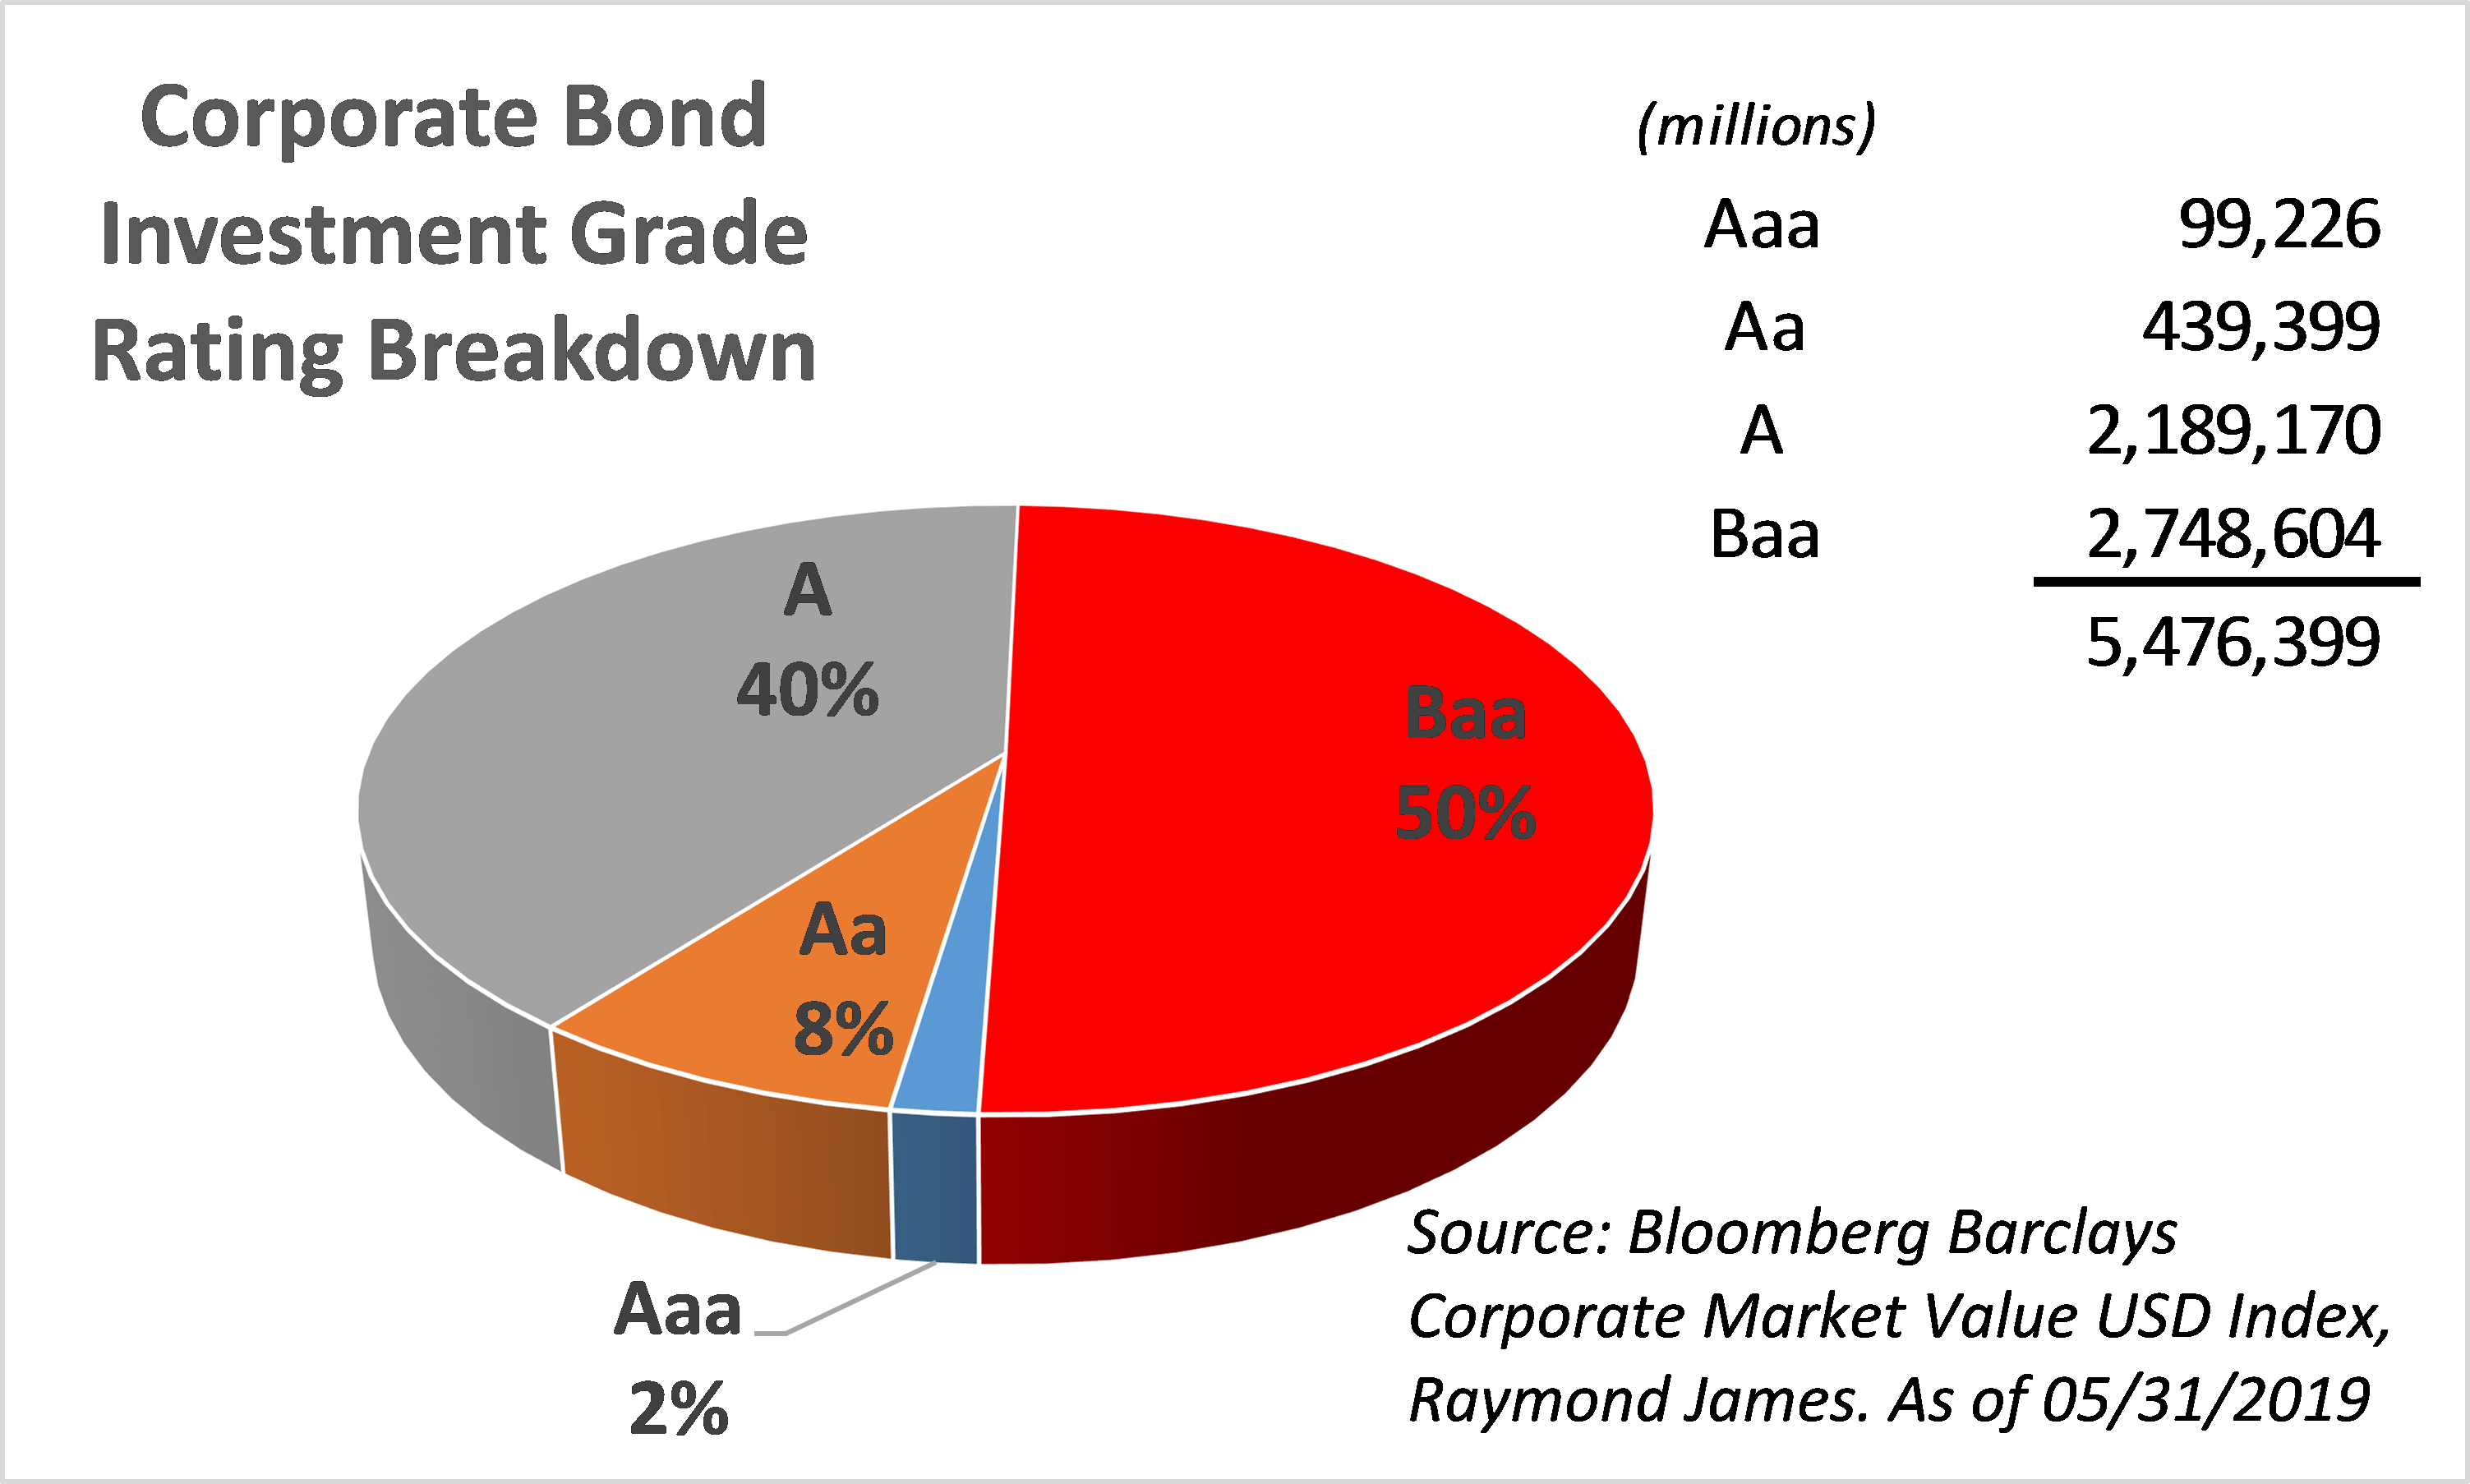
Half of the investment-grade corporate issues are rated Baa according to Bloomberg Barclays Corporate Market Value index. This is important for investors wanting to choose from the greatest available supply that also fits their risk profile. It is worth noting the minimal default difference between investment-grade rated corporate bonds coupled the additional yield pick-up.
Last, take a look at the heat map chart to the right. The darkest green years represent those that give investors the greatest incremental value compared to the entire corporate curve. As of this morning, the 6-8 year corporate maturities represent the “sweet spot” of the corporate curve. Of course with all the market uncertainty, layering or laddering maturities may provide the greatest protection against interest rate changes.
Investment-grade corporate bonds generally fit many investor risk profiles, maintain good spread to Treasuries and can be an important component to an investor’s core investment portfolio.
